Andrea Di Antonio
Air quality and atmospheric physics

CONTACT ME:

Follows me
RSS
  • About me
  • OsservaTE
  • Vajont
  • EN
    • IT
Air Quality Air Quality, Clean Air Zone, Electric Vehicles, Policy
1

Britain’s first Zero Emissions Zone

This blog was originally written for New AutoMotive and accessible here.

Last month, Oxfordshire County Council and Oxford City Council will introduce Britain’s first Zero Emission Zone (ZEZ) in Oxford. The pilot scheme started on 28th February 2022 and applies to a limited number of roads in the city centre. Nonetheless, Oxford ZEZ represents a radical change compared to most already existing Clean Air Zones (CAZ) across the country, as ultra low emitting vehicles (i.e. vehicles with emissions of 75 gCO2/km or less) travelling across the region will now face a fee.

Clean Air Zones are restricted areas where only the cleanest (i.e. less emitting) vehicles are encouraged to drive. Any non-compliant vehicle would be required to pay a fee to travel across the zone. The Government introduced this measure to improve air quality in response to the increasing concern about the impact of air pollution on human health.

In addition to the expected CAZ objectives, Oxford’s ZEZ aims to promote the shift towards zero-emission transport, thus slashing carbon emissions. For this reason, we investigated whether the introduction of Oxford’s ZEZ or a CAZ in general impacts the car market using Birmingham and Oxford’s case studies.

Birmingham City Council initially intended to introduce a CAZ in early 2020. The launch date was postponed to 1st June 2021 in response to the Covid-19 pandemic. We compared the UK average and Birmingham’s market share of Battery Electric Vehicles (BEVs) as a function of time, as shown in Figure 1.
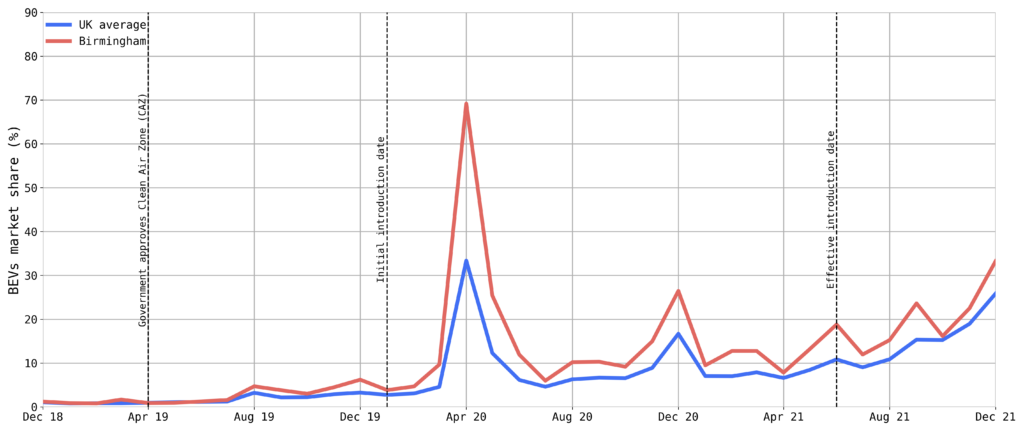
Figure 1. Time series plot of UK’s average and Birmingham Battery Electric Vehicles (BEVs) market share. The black dotted lines represent the key dates in the policy introduction. The data is relative to the period between December 2018 and December 2021. Source: New AutoMotive.

Figure 1 indicates that Birmingham’s BEVs market share matched the UK average until the Government approved the CAZ. Shortly after this event, Birmingham’s BEVs market share climbed consistently above the UK’s average. A similar trend can be observed for Oxford in Figure 2.
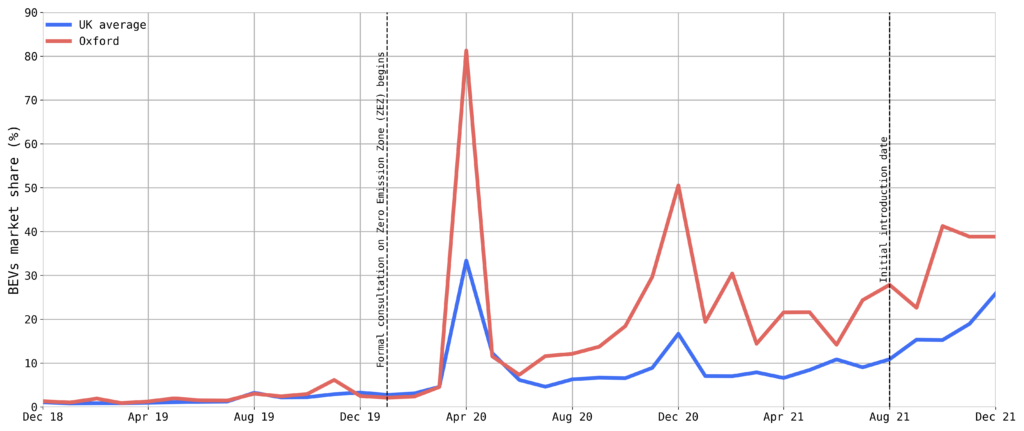
Figure 2. Time series plot of UK’s average and Oxford Battery Electric Vehicles (BEVs) market share. The black dotted lines represent the key dates in the policy introduction. The data is relative to the period between December 2018 and December 2021. Source: New AutoMotive.

The behaviour observed in Figure 2 indicates that the introduction of the ZEZ seems to accelerate the uptake of zero-emission vehicles in the area, as desired by the policy.

BEVs market share data for the considered case studies suggest that the introduction of Clean Air (or Zero Emission) Zones promotes the uptake of BEVs. Specifically, an increase in BEVs sales was observed after the policies were approved or announced, regardless of whether the launch date was postponed for different reasons.

While Oxford represents the first and only Zero Emission Zone in the UK, other councils like Bradford and Great Manchester will introduce CAZ later this year, hopefully increasing the uptake of electric vehicles in these areas.
Air Quality Air Quality, Climate, Human Health, Particulate Matter
2

Saharan dust: the possible issues with particles long-range transport

Last Thursday, most people living in southern England, like myself, witnessed orange skies and, later, found sand deposited on their windows, cars or front door. As an atmospheric scientist, a few weeks before it, I installed a low-cost sensor (see Tech specs section below) for air quality monitoring just outside my window to gather an indicative measurement of the levels of pollutants in the neighbourhood where I live. The device provides measurements of temperature, relative humidity and pressure, and indicative levels of PM2.5, PM10. Roughly speaking, PM2.5, PM10 refer to the concentration in the form of mass of all the particles with a diameter smaller than 2.5 and 10 micrometres, respectively. A more accurate definition of PM mass concentrations is provided by the European Union Council [1]. Still, the approximate description is sufficient for the discussion that follows.


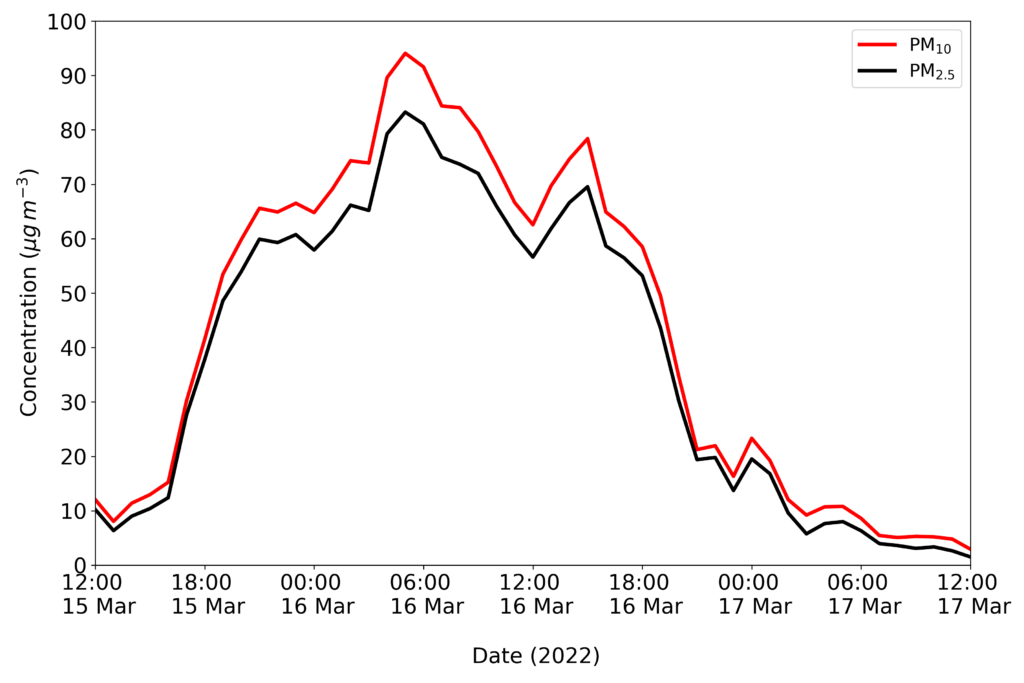
Fascinated by the amount of dust being transported from the Sahara desert, I wanted to check whether my sensor was able to provide data indicating that the event took place. In particular, I was curious to see how the presence of sand affected, if at all, the PM levels. Therefore, I downloaded the PM concentration data from my sensor and produced the plot shown in Figure 1.

Figure 1. Time series plot of PM2.5 (black) and PM10 (red). The data is relative to the period between 15th March 2022 12:00 UTC and 17th March 2022 12:00 UTC.  © Andrea Di Antonio.


Figure 1 exhibits a range of stimulating features. Firstly, PM2.5 and PM10 concentrations have increased by up to a factor of 9 compared to before (15th March) and after (17th March) the event. Secondly, it is evident how the discrepancy between PM2.5 and PM10 concentrations increases during the 16th March. This behaviour can be explained considering the wide range of Saharan dust particles dimensions, from 0.1 to 50 micrometres. Consequently, if a higher fraction of particles greater than 2.5 micrometres is present, the concentration of PM10 starts to deviate significantly from PM2.5, as observed in Figure 1. Thirdly, the slight decrease in PM concentration around midday on 16th March was caused by rain. This phenomenon is an aerosol removal mechanism called washout [2]. In simple words, the droplets capture particles and deposit them on the ground when it rains. That is why you may have found traces of sand on your window or your wheelie bin.


This fascinating event served as a perfect example to analyse and explain some of the most common aerosol phenomena in the atmosphere. But that is not the end of the story. We observed and witnessed how large concentrations of Saharan dust can be transported for long distances with the right combination of convection and winds. While inhaling sand is not particularly harmful, it could still irritate a person’s airways and cause respiratory issues, especially to allergic and susceptible individuals. The long transport of Saharan dust highlights the threat to human health when more toxic particles emitted in the atmosphere can spread across the globe. In this light, a definition of PM as mass concentration without chemical speciation results insufficient. The risk of jeopardising reduced policy emissions by single nations without them being shared globally (see COP26) becomes more real.

References

[1] The European Parliament and of the council of the European Union. Directive 2008/50/EC of the European Parliament and of the council of 21 May 2008 on ambient air quality and cleaner air for Europe. Official Journal of the European Union 2008, 51, 1–44.

[2] Kajino, Mizuo, and Masahide Aikawa. “A model validation study of the washout/rainout contribution of sulfate and nitrate in wet deposition compared with precipitation chemistry data in Japan.” Atmospheric Environment 117 (2015): 124-134.

Tech specs

The sensor used to measure PM levels is a PMS5003;
The sensor used to measure temperature, relative humidity and pressure is a BME280 mounted on the Enviro for Raspberry Pi;
Both sensors are connected to a Raspberry Pi Zero. The data are sent to the Luftdaten website and are open access; To download the data relative to my sensors and the code to generate the plot shown above, visit my dedicated GitHub repo.

1 2
Back to top
  • About me
  • Blog
  • Vajont
  • Milestones
CONTACT ME:

© Andrea Di Antonio 2026
visitControguerra.it: La città del buon vivere

Privacy Policy