Andrea Di Antonio
Air quality and atmospheric physics

CONTACT ME:

Follows me
RSS
  • About me
  • OsservaTE
  • Vajont
  • EN
    • IT
IMG_8938
Air Quality Aerei, Aeromobili, Atmosfera, Crociera, Quote, Scie Chimiche, Scie Condensazione, Troposfera
0

Proposta di legge “Cieli Blu” – Sgomberiamo i dubbi sulle scie nei cieli italiani

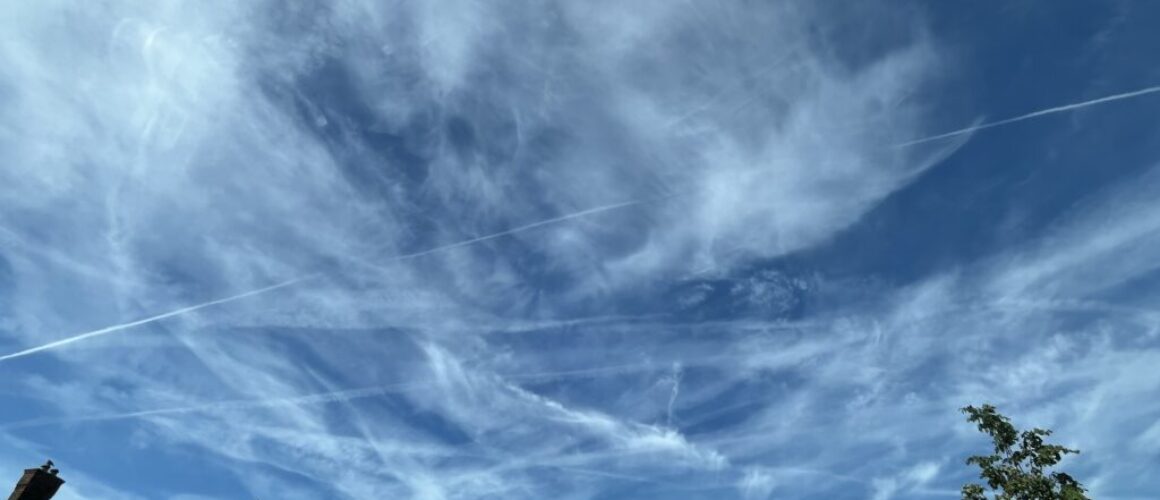
Lo scorso 10 maggio è iniziata la raccolta firme per una proposta di legge di iniziativa popolare denominata “Cieli Blu”, che mira a introdurre un divieto alla “modifica delle condizioni metereologiche attraverso attività di geoingegneria nei cieli italiani”. Al di là del refuso presente nel testo (“metereologiche” anziché “meteorologiche”), la proposta fa riferimento ai cieli italiani e al rilascio in atmosfera di sostanze con lo scopo di alterarne composizione, comportamento o dinamica. In particolare, l’articolo 6 sembra richiamare il tema delle cosiddette “scie chimiche”, un’ipotesi diffusa da diversi decenni secondo cui gli aeromobili, oltre ai normali gas di scarico, rilascerebbero sostanze con finalità che andrebbero dalla modifica del clima fino ad altre forme di intervento sull’ambiente e sulla popolazione.

L’iniziativa ha raccolto un notevole interesse: a due settimane dall’avvio erano già state superate le 23.000 adesioni, avvicinandosi rapidamente alla soglia delle 50.000 firme necessarie affinché la proposta possa essere depositata presso la Presidenza della Camera dei Deputati o del Senato della Repubblica. Alla luce di ciò, è utile chiarire alcuni aspetti scientifici legati al fenomeno osservabile nei cieli. Quelle scie che vengono definite “chimiche”, altro non sono che scie di condensazione che si formano a causa del vapore acqueo presente nei gas di scarico dei motori a reazione degli aerei.  Le elevate temperature dei gas emessi dai motori e le basse temperature presenti alle quote di crociera determinano un rapido raffreddamento del vapore acqueo contenuto nei gas di scarico. In queste condizioni, il vapore può passare rapidamente allo stato solido attraverso il processo di brinamento, formando minuscoli cristalli di ghiaccio. La presenza, nei gas di scarico, di particelle che fungono da nuclei di condensazione, favorisce lo sviluppo delle caratteristiche scie di condensazione visibili nel cielo. 

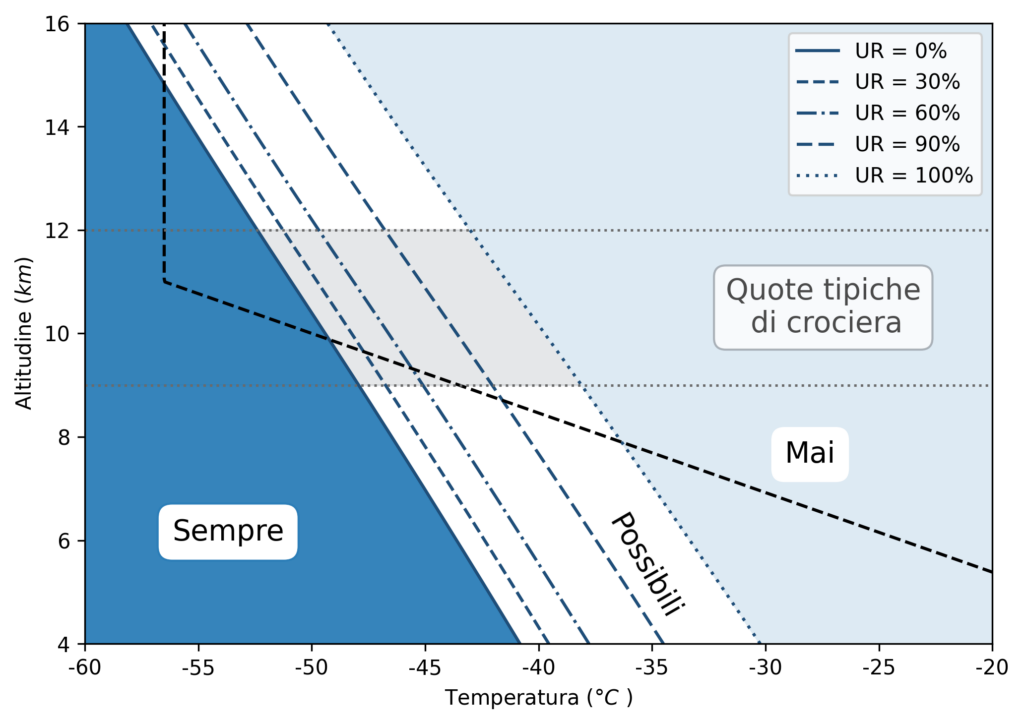
Affinché queste scie si formino, c’è bisogno di particolari condizioni che possono essere sintetizzate nel diagramma mostrato in Figura 1 che illustra il criterio di Schmidt–Appleman. 

Figura 1. Diagramma schematico del criterio di Schmidt–Appleman per la formazione delle scie di condensazione in funzione della temperatura e dell’umidità relativa (UR). La regione blu identifica le condizioni nelle quali le scie di condensazione si formano sempre, indipendentemente dal contenuto di umidità dell’atmosfera. La regione centrale (bianca) rappresenta invece condizioni intermedie nelle quali la formazione delle scie dipende dall’umidità relativa (UR). La regione chiara sulla destra indica infine le condizioni per le quali le scie non possono formarsi. Le linee blu tratteggiate mostrano il criterio di formazione per diversi valori di umidità relativa, mentre la linea tratteggiata nera rappresenta il profilo verticale standard della temperatura atmosferica al variare della quota. La banda grigia evidenzia infine le tipiche quote di crociera degli aeromobili commerciali.


Quando la temperatura dell’aria è sufficientemente bassa, come mostrato nella regione colorata in blu del diagramma di Figura 1, le scie di condensazione possono formarsi anche in presenza di aria molto secca. In questa regione del grafico, infatti, la formazione delle scie avviene indipendentemente dal contenuto di umidità dell’atmosfera e può verificarsi persino per valori di umidità relativa prossimi allo 0%. Esiste poi una fascia intermedia di temperature, rappresentata dalla regione bianca del diagramma, nella quale la formazione delle scie dipende anche dal contenuto di vapore acqueo presente in atmosfera. In queste condizioni, le scie si formeranno soltanto qualora l’umidità relativa raggiunga determinati valori critici. Infine, per temperature superiori a una certa soglia, la formazione delle scie non risulta più possibile nemmeno nel caso di aria completamente satura di vapore acqueo, cioè con umidità relativa pari al 100%.

La Figura 1 mostra inoltre come vari la temperatura standard dell’atmosfera al crescere della quota attraverso la linea tratteggiata nera, insieme all’intervallo tipico delle quote di crociera degli aeromobili, rappresentato dalla zona grigia. Il profilo termico riportato nel diagramma corrisponde alle condizioni standard dell’atmosfera, definite assumendo valori convenzionali di temperatura e pressione al livello del mare. Nella realtà, tuttavia, il profilo verticale della temperatura può differire da quello standard e variare sia da un giorno all’altro sia nel corso della stessa giornata. Per questo motivo vengono effettuati regolarmente lanci di palloni sonda, generalmente nelle prime ore del mattino, che permettono di misurare il profilo verticale di temperatura, pressione e umidità dell’atmosfera. Utilizzando queste osservazioni è possibile aggiornare il profilo mostrato in Figura 1 e valutare, nota la quota di crociera degli aeromobili, quanto sia probabile osservare la formazione di scie di condensazione nei nostri cieli. La presenza o l’assenza delle scie, quindi, non dipende da fenomeni insoliti, ma da ben note condizioni atmosferiche e dalle quote alle quali avviene il volo. 

Tra le ipotesi più frequentemente associate alle “scie chimiche” vi è quella secondo cui eventuali sostanze rilasciate dagli aerei possano raggiungere il suolo in modo tale da influenzare l’ambiente o la salute umana. Tuttavia, gli aeromobili commerciali operano tipicamente tra i 9 e i 12 km di quota, come mostrato in Figura 1. A queste altitudini, i processi di dispersione atmosferica, la circolazione dei venti e la presenza dello strato limite planetario favoriscono una forte diluizione delle sostanze eventualmente presenti, rendendo molto difficile che possano raggiungere il suolo in concentrazioni significative.

Un altro aspetto spesso discusso riguarda la percezione di una maggiore frequenza e persistenza delle scie rispetto al passato. Secondo le stime di FlightRadar24, ogni giorno vengono effettuati oltre 100.000 voli a livello globale. In Italia, i dati dell’Ente Nazionale per l’Aviazione Civile (ENAC) mostrano che il numero di movimenti del traffico commerciale è aumentato di oltre il 20% tra il 2005 e il 2025. A ciò si aggiungono i voli cargo e gli aeromobili che attraversano lo spazio aereo nazionale senza effettuare scali. L’aumento del traffico aereo contribuisce quindi naturalmente a una maggiore presenza di scie nei cieli. Per quanto riguarda invece la loro persistenza, il fenomeno dipende ancora una volta dalle condizioni atmosferiche. Se l’aria è particolarmente secca, i cristalli di ghiaccio che compongono la scia sublimano rapidamente tornando allo stato gassoso e la scia scompare in tempi brevi. Se invece l’aria è molto umida, il processo di sublimazione risulta meno efficiente e le scie possono permanere più a lungo, estendendosi anche su vaste aree.

Sebbene la formazione delle scie di condensazione non sia un fenomeno intenzionale, il loro impatto climatico rappresenta oggi un tema di ricerca molto attivo. Studi recenti suggeriscono infatti che le scie persistenti possano contribuire al riscaldamento climatico attraverso effetti radiativi, in alcuni casi con un impatto comparabile o superiore a quello delle emissioni dirette associate alla combustione del carburante. Tra le possibili strategie di mitigazione proposte vi è quella avanzata dall’Imperial College di Londra: modificando la quota di crociera di circa 2000 piedi (circa 600 metri) in determinate condizioni atmosferiche, sarebbe possibile evitare le zone favorevoli alla formazione delle scie, riducendone sensibilmente l’impatto climatico.

Tornando alla proposta di legge di iniziativa popolare “Cieli Blu”, il raggiungimento delle 50.000 firme verificate consentirebbe il deposito del testo presso una delle due Camere del Parlamento. Successivamente, la proposta verrebbe sottoposta alle verifiche dell’Ufficio di Presidenza, annunciata all’Assemblea e assegnata alla commissione parlamentare competente per l’esame. Storicamente, tuttavia, le proposte di legge di iniziativa popolare presentano tassi di approvazione relativamente contenuti, anche perché la loro discussione dipende dalle priorità e dalle scelte di calendarizzazione parlamentare. Al momento della stesura di questo articolo, non risultano adesioni ufficiali da parte di esponenti politici alla proposta “Cieli Blu”.

Nel caso in cui la proposta dovesse proseguire il proprio iter legislativo, potrebbe inoltre emergere il tema delle modalità di applicazione e verifica delle eventuali disposizioni previste, in particolare per quanto riguarda l’accertamento delle violazioni e l’impatto operativo sul traffico aereo nazionale e internazionale.

Air crash Air crash, Air India 171, Air Safety, Airplane disaster, Aviation, Boeing, investigation, plane
1

What we really know about the Air India 171 crash


© ZhangerAviation

This blog was originally written for Il Trafiletto and accessible here.

The recent Air India Flight 171 accident, in which a Boeing 787-8 Dreamliner crashed into a building shortly after taking off from Ahmedabad Airport on June 12, 2025, captured global attention due to the speed and severity of the events. At 13:37:33 local time (08:07:33 UTC), the aircraft received clearance for take-off from Runway 23. Five seconds later, it began its take-off roll, reaching VR—the speed at which pilots initiate rotation—and lifted off at 13:38:39 local time. The aircraft remained airborne for less than a minute before crashing into a building, resulting in the deaths of 260 people, including 229 passengers, 12 crew members, and 19 people on the ground.

The speed at which this tragedy unfolded immediately sparked speculation about the causes of the crash: a bird strike, a technical failure, or human error? Videos of the incident began circulating online, fueling theories that the aircraft had not used the entire runway, that the flaps had not been correctly set, or that a dual engine failure had occurred.

As is standard in these cases, authorities immediately launched an investigation led by India’s Aircraft Accident Investigation Bureau (AAIB), with support from the UK AAIB since the flight was bound for London, and the US National Transportation Safety Board (NTSB) as the aircraft was manufactured in the United States. Within two days of the accident, both black boxes were recovered, containing the flight data and cockpit voice recordings.

As an aviation enthusiast and ultralight planes pilot, I followed every update closely to better understand what might have happened. However, I immediately noticed how, even in the first hours, unverified theories began circulating online, often shared simply to capture attention, alongside a constant wave of accusations against Boeing, regardless of the actual circumstances. The first available data confirmed that the aircraft had used the full length of the runway, ruling out one of the initial theories. Additionally, early analyses by experienced airline pilots clarified that an incorrect flap setting would trigger multiple visual and aural warnings in the cockpit, giving the pilots the opportunity to abort the take-off, making this scenario unlikely.

On July 8, 2025, just over three weeks after the accident, investigators released their initial findings, revealing an unexpected element: just seconds after take-off, the switches controlling fuel flow to the engines were moved from RUN to CUTOFF one second apart, causing both engines to lose power. Cockpit recordings captured one pilot asking the other why they had cut off the fuel supply, with the other replying that they had not done so.

The preliminary report identified the probable cause as the loss of engine power due to fuel cutoff during the critical take-off phase, also confirming that the flaps were correctly configured. However, the dynamics of the incident require further investigation to determine whether it was due to human error or a mechanical fault. In the weeks following the preliminary report, some newspapers reported leaks suggesting that Captain Sumeet Sabharwal had intentionally cut the fuel supply due to alleged depression, but such claims remain unconfirmed and can only be verified once the final report is released.

After tragic events like this, it is understandable that there is a collective need to find answers and understand what happened. However, spreading premature or oversimplified theories risks creating confusion and hindering the fact-finding process. Once a narrative takes hold in public opinion, it can be difficult to change it later, even in the light of new data.

We live in an age that demands immediate answers to everything, but complex operations like air accident investigations require time, expertise, and rigor to reach reliable conclusions. As aviation enthusiasts, professionals, or simply observers, we have a responsibility to resist the temptation to speculate for views or engagement and to respect the investigation timelines, waiting for concrete data before forming judgments.

Only in this way can we transform tragedies like this into opportunities for collective learning, helping to improve aviation safety and understanding while avoiding adding confusion where clarity and respect are needed most.

VVF
Uncategorized
0

Fire emergency in Teramo Province: environmental and climate impacts

This blog was originally written for Il Trafiletto and accessible here.

The fire that hit the town of Carapollo on Thursday and the one in Castiglione Messer Raimondo on Friday are just the latest episodes, in chronological order, of a worrying phenomenon of wildfires that, especially in summer, afflict our province and our region.

Regardless of whether these fires are deliberate or not, their increasing number and the expansion of the affected areas raise serious questions about their environmental impact. The response to such questions is complex and encompasses multiple aspects. Firstly, there is the impact on local wildlife, forced to abandon their habitat due to the fires, which sometimes also leads to the evacuation of human populations living nearby. Secondly, there is the local environmental impact related to the emission of pollutants due to the combustion of wood, such as fine particulate matter and carbon monoxide, which are extremely toxic to humans, especially in high concentrations. Lastly, but not least, the fundamental role played by trees in absorbing carbon dioxide (CO₂) must be considered.

During the day, in the presence of sunlight, the leaves of trees use chlorophyll, a special pigment capable of capturing sunlight, to perform photosynthesis, a chemical reaction that converts carbon dioxide and water into glucose and oxygen. The carbon dioxide absorbed for this reaction is then stored in the woody tissues of the tree, where it can remain for decades or even centuries.

It is therefore easy to understand the importance of trees and, in general, forests in the fight against the climate crisis caused by the increase in carbon dioxide concentration in the atmosphere. From this perspective, the occurrence of a fire has a dual negative effect on the environment: not only is the area capable of absorbing carbon dioxide through photosynthesis reduced, but the CO₂ that had been stored in the trees throughout their lives is released back into the atmosphere.

The release of stored carbon dioxide in trees can occur not only through fires but also through deforestation, with negative environmental effects similar to those described. The reduction of forested areas due to fires contributes to accelerating an already rapid process of climate change. Therefore, it is essential to preserve existing forest areas, especially from deliberate acts of arson, and to ensure the restoration of those destroyed as quickly and efficiently as possible.

4a5546a4-d971-4e2b-9935-78dc56d9e0cd
Uncategorized cambiamenti climatici, cielo italiano, CNR, fenomeni atmosferici, geoingegneria, impatto ambientale, ISAC, particelle atmosferiche, polvere del Sahara, scirocco, trasporto della polvere
0

Sahara or Geoengineering? Let’s unravel the mystery of the dust that has invaded the skies of Italy

Last week, a fascinating mass of air loaded with Sahara desert sand enveloped much of Italy, transforming the sky into a captivating display of milky and yellowish hues. This phenomenon sparked a wave of theories on social networks. Many users, abandoning the Sahara hypothesis, leaned towards alternative scenarios such as climate control through geoengineering. The duration and intensity of the event fueled debate, stimulating imagination and suspicion. Let’s explore this topic together to dispel any doubts and gain a clearer understanding of both the situation and our skies.

Is the substance in the sky really sand?

The answer is both yes and no. Yes, because it is Sahara sand, but not in the form we typically imagine. These are not the grains of sand found on our beaches. Sahara dust particles are extremely small, on the order of micrometres, ten times smaller than a human hair. These particles remain suspended in the atmosphere thanks to strong winds like the sirocco, which lift and carry them far away. It would therefore be more accurate to refer to it as Sahara dust.

How does the sand travel so far?

Although the Sahara seems distant from Italy, Sahara dust can travel much farther. For example, in March 2022, it reached as far as the United Kingdom (an event discussed in this blog). Once suspended in the atmosphere, these particles can linger there for a long time, moving with the winds and atmospheric currents. Consider the spread of particles emitted during the 2010 eruption of Iceland’s Eyjafjallajökull volcano, which caused serious air navigation problems across Europe.

How can we be sure it’s Sahara sand?

Data collected from the observatory “Ottavio Vittori” on Mount Cimone by ISAC (Institute of Atmospheric Sciences and Climate) of CNR show a significant increase in particles with diameters greater than one micron, consistent with the size of Sahara dust particles and above the threshold for identifying dust transport. Satellite images and air mass tracking programs from the US NOAA (National Oceanic and Atmospheric Administration) also confirm the Saharan origin of this dust cloud. Furthermore, atmospheric particulate monitoring stations equipped with chemically analyzable filters provide additional evidence.

Is Sahara dust transported only when there is wind?

Wind speed varies with altitude. Even when it seems calm at ground level, winds can be strong at higher altitudes. These upper-level winds are responsible for transporting sandy material, regardless of surface calm.

Why is this phenomenon more frequent and lasting longer nowdays?

In recent years, changes in atmospheric circulation have made this phenomenon more common. Italian summers traditionally featured the anticyclone of the Azores, which provided stable weather. Today, also due to increased Atlantic Ocean temperatures, the anticyclone of the Azores has been replaced by the subtropical anticyclone of the African. This extends from the Sahara, bringing not only dust but also high temperatures and humid heat.

In conclusion, understanding complex phenomena like Sahara dust transport requires informed curiosity and research based on reliable data. It’s crucial to avoid hasty conclusions or theories unsupported by concrete evidence. Everyone has the right to express doubts and curiosity, but the most fruitful approach remains deepening our understanding of the topics. This way, we can navigate environmental challenges with awareness and responsibility, preserving clarity both in our understanding and in our public discourse.

AviationInsurance-TurbulentTimesExpected-Marsh-TimBlakey-Bg-w
Climate Change air travel safety, air turbulence, clear air turbulence, Climate, jet streams and turbulence
1

Air Turbulence: what it is and why it is increasing

This blog was originally written for Il Trafiletto and accessible here.

Over the past two weeks, two flights have encountered turbulence strong enough to cause several injuries and, in one case, a death suspected to be from a heart attack. But what is turbulence, and how does it form? Here’s a closer look at this fascinating atmospheric phenomenon that anyone who has flown has experienced at least once.

Turbulence refers to the irregular movements of air vortices manifested through chaotic variations in speed and pressure, which can cause oscillations and shaking of the aircraft. A clear example of turbulence is cigarette smoke: initially, its motion is laminar, meaning without vortices, but after a few centimetres, it starts to become turbulent, creating the typical vortices and convolutions.

The most common turbulence phenomena encountered during a flight are convective turbulence (updrafts generated by solar heating, particularly intense over heated surfaces like cities or deserts), orographic turbulence (stationary waves in the atmosphere formed when a uniform airflow meets and overcomes an obstacle, such as mountain ranges, along its path), and wind shear (strong updrafts and downdrafts that can form near stormy areas), typically occurring at relatively low altitudes. However, it is not always possible to associate turbulence with visible atmospheric conditions or detect it with instruments. This is the case with CAT (Clear Air Turbulence), which forms when two layers of air with different temperatures move at different speeds, and the interface between the two layers creates waves in the air that, when breaking, become turbulent. It is precisely this type of turbulence that the Singapore Airlines flight SQ321 on May 21 and Qatar Airways flight QR017 on May 26 encountered.

CAT is usually more intense in the presence of very strong winds like jet streams: “rivers of air” with a cross-section of several tens of kilometers, extending for thousands of kilometers, with winds blowing from west to east at speeds between 150 and 400 km/h. Jet streams are found in the troposphere, the region of the atmosphere closest to the Earth’s surface, at an altitude between 6 and 12 km, the same as commercial flights. When possible, commercial pilots flying from west to east seek these currents to reduce flight times and fuel consumption. Since this type of turbulence has a limited vertical extent, pilots can exit CAT by taking the aircraft to a higher or lower altitude.

According to the latest study by the U.S. Federal Aviation Administration (FAA), between 2009 and 2022, 163 people, including passengers and crew, suffered serious injuries due to turbulence. This is because CAT manifests so suddenly that it is very difficult for crew members to warn passengers to fasten their seatbelts, increasing the risk of being thrown around the cabin.

Although injuries caused by turbulence are not new in aviation, a recent study by the University of Reading suggests that their number is set to increase. The research indicates that the presence of intense turbulence over the North Atlantic has increased by 55% in recent years, rising from 17.7 hours in 1979 to 27.4 hours in 2020. The study attributes the increase in turbulence to climate change: the warmer atmosphere, due to higher carbon dioxide emissions, is increasing wind shear within jet streams, leading to an increase in regions worldwide affected by CAT.

Turbulence is an integral part of flying. Pilots are trained to handle it, and airplanes are designed to withstand it. However, due to its unpredictability, it is always advisable to keep your seatbelt fastened for the entire duration of the flight, regardless of the latest news.

EV
Air Quality, Climate Change Carbon Emissions, Climate, Electric Vehicles
0

Electrifying Earth Day: comparing emissions from Internal Combustion Engine (ICE) cars and Electric Vehicles (EVs)

As we celebrate Earth Day on April 22nd, it’s crucial to reflect on our environmental impact, especially in terms of transportation. Vehicles powered by internal combustion engines (ICE) are significant contributors to carbon emissions, but determining the sustainability of electric vehicles (EVs) compared to ICE cars, considering that electricity is mostly produced by burning fossil fuels, becomes crucial. Let’s delve into the details of this topic with the aid of real-world numbers.

According to the U.S. Energy Information Administration (EIA), the average emissions from burning fossil fuels to generate electricity are around 0.45 kg of CO2 per kWh.

Now, let’s compare the fuel efficiency of an ICE vehicle with an EV. Using data from Spritmonitor, it is possible to determine that petrol cars have an average fuel efficiency of around 7.92 miles per litre, while diesel cars have around 9.42 miles per litre. By selecting a value in between the two, it is possible to determine the average fuel efficiency of an ICE vehicle is approximately 8.67 miles per litre. On the other hand, EVs have an average efficiency of 3.3 miles per kWh, equivalent to 29.04 miles per litre.

Now, let’s put these numbers into perspective for carbon emissions. According to the latest data, the average UK driver travels around 7,000 miles a year.

For ICE vehicles:
7000 miles / 8.7 miles per litre = 804.59 litres of fuel used annually.

For EVs:
7000 miles / 3.3 miles per kWh = 2121.21 kWh consumed annually.

Using the UK Department for Environment, Food & Rural Affairs (DEFRA) emissions data, it can be found that burning one litre of petrol or diesel emits around 2.4 kg of CO2. The carbon emissions for an ICE vehicle compared to an EV can be derived as follows:

ICE vehicle: 804.59 litres * 2.4 kg CO2 per litre = 1931.03 kg of CO2 emitted annually.
EV: 2121.21 kWh * 0.45 kg CO2/kWh = 954.54 kg of CO2 emitted annually.

From these numbers, it’s evident that even if all the electricity used by EVs were produced from fossil fuels, the emissions would still be lower than those of ICE vehicles by 976.49 kg of CO2 per year per vehicle. However, it’s important to note that not all electricity is produced using fossil fuels. Renewable energy sources like solar, wind, and hydroelectric power make up a significant portion of many countries’ electricity grids.

Beyond just carbon emissions, there’s another crucial aspect to consider: air quality. ICE vehicles emit pollutants like nitrogen oxides (NOx) and particulate matter (PM), contributing to poor air quality, especially in urban areas.
While ICE vehicles emit these pollutants directly into the local environment, power plants are often located away from densely populated areas. This means that even if the electricity for EVs comes from fossil fuels, the emissions are more centralised, leading to better air quality in urban centres.

By transitioning to electric vehicles and simultaneously increasing the share of renewable energy in the grid, we can drastically reduce carbon emissions from transportation while also improving local air quality. This Earth Day, let’s celebrate the potential of EVs to drive us towards a cleaner, greener future.

References:

[1] US EIA (2024), https://www.eia.gov/
[2] Spritmonitor (2024),  https://www.spritmonitor.de/
[3] DEFRA (2007), Guidelines to Defra’s GHG conversion factors for company reporting, www.defra.gov.uk

Uncategorized
0

1963 – 2023: 60 years from the Vajont dam disaster

It is October and, like every year in this period, it is the anniversary of the Vajont disaster: a tragic event that, despite its extent and importance, is not widely known. This year, in particular, marks the 60th anniversary of the disaster and the President of the Italian Republic Sergio Mattarella will attend the celebrations.

The Vajont disaster happened as a result of the construction of a dam inside the Vajont valley, in Northern Italy. The dam, known as Vajont dam and depicted in Figure 1, was built to hold up to 150 millions m3 of water. According to the most accredited hypothesis, the presence of the lake caused the mobilisation of a large and ancient landslide mass present on the left bank of the lake.

Figure 1 Vajont dam as seen from Longarone (Italy).

On 9th October 1963, at 10:39pm, a 270 million m3 landslide entered the lake at a velocity of 100 km/h.The large amount of material entering the lake so quickly caused the displacement of 50 out of around 115 million m3 of water present in the lake at the time. The resulting wave reached an height of 200 metres and divided into three parts: the first rose up the orographic right bank of the lake, the second travelled backwards across the lake and the third, of approximately 25 million m3, proceeded in the direction of the dam, jumped over it and flowed into the valley below. Each of the three parts of the wave razed everything in their path and caused the death of 1910 people.

Figure 2 Slip surface of Vajont landslide as seen from Casso (Italy).

The causes and those responsible for what happened have been the subject of a long trial and several scientific studies which are still trying to explain the mechanism of such an unprecedented event. The dynamics that led to the disaster and the subsequent implications have always aroused great interest on my part, since I learned about it at the age of seven. The interest in the matter has increased significantly over the last few years following the reading of a large number of books on the topic and the interaction with survivors and academics making research on the phenomenon. For the 60th anniversary, I decided to return to the places where the disaster took place to give my modest contribution on the topic: watch this space in the coming days to find out what it is.

2596
Climate Change Climate, GHG, Greenhouse Gases, Methane, Russia, Ukraine
2

Nord Stream methane emissions: impact and implication on climate

The Nord Stream, a natural gas pipeline running from Russia to Germany under the Baltic Sea, has suffered from different leaks (4 at the time of writing) since last Monday, 26th September. The pipeline was not in use when the leaks emerged, as Gazprom shut it down indefinitely on 2nd September 2022. Nonetheless, methane was present in the conduit and is now emitted almost directly into the atmosphere.

Gas emerging from pipeline leak in Baltic Sea. Credits: Forsvaret- Danish armed force

While examining the causes of the leaks would be beyond the scope of this article, it is crucial to understand the implication of methane release in the atmosphere and its impact on the environment and climate.

The Umweltbundesamt – UBA, the German Environment Agency, estimated that between 300,000 and 350,000 tonnes of methane are being emitted from the Nord Stream. However, the exact number is difficult to determine. To put these figures in context, the International Energy Agency (IEA) estimated the methane emissions in 2021 to be 580 Million tonnes (Mt), of which 350 Mt (approximately 60% of the total) come from anthropogenic activities [1]. Therefore, the highest UBA estimate of 350,000 tonnes of methane from the Nord Stream corresponds to 0.1% of the anthropogenic and just ~0.06% of the total methane emissions for 2021.

While these numbers seem negligible, the implications on climate are considerable. Methane is one of the most effective greenhouse gases (GHGs) in the atmosphere. While the usual lifetime of methane (few years) in the atmosphere is much smaller than carbon dioxide (hundreds of years), its impact is much more significant. To quantify the effects of different GHGs, the Intergovernmental Panel on Climate Change (IPCC) uses a metric called the Global Warming Potential (GWP). The GWP determines the impact of a tonne of a given GHG emitted over a time window (usually 20 and 100 years) in terms of CO2 equivalent. Methane has a GWP of 28 over 100 years [2]. In other words, each tonne of methane emitted is equivalent to 28 tonnes of CO2. In these terms, it is straightforward to understand how 350,000 tonnes of methane from Nord Stream correspond to 9.8 Mt of CO2. The latter value corresponds to as much as 3% of the yearly UK CO2 emissions [3].

One of the most common uses of methane is heat production by combustion. Therefore, it is natural to wonder what would have been the impact of the same amount of methane released now in the Nord Stream if it had been burnt. Chemistry helps answer this question. Methane combustion is the reaction between methane (CH4) and oxygen (O2) in the air. This reaction produces CO2, water (H2O), and energy. Therefore, the impact of burning 350,000 tonnes of CH4 is the same as emitting 350,000 tonnes of CO2 directly into the atmosphere. This value is much lower, precisely by a factor of 28, than the 9.8 Mt determined previously, while also producing energy.

The additional methane introduced into the atmosphere due to the Nord Stream leaks helps emphasise an already critical situation regarding methane emissions. While carbon dioxide (i.e. burning methane) emissions are always preferable to direct methane emissions, they still represent GHGs emissions. As such, it should be reduced to mitigate global warming. Moving towards renewable and more sustainable ways of producing energy is critical to avoid emissions of GHGs, whether directly or indirectly, and having to pay the environmental price when episodes such as the leaks in the Nord Stream occour.

References:

[1] IEA (2022), Global Methane Tracker 2022, IEA, Paris https://www.iea.org/reports/global-methane-tracker-2022

[2] Myhre, G., D. Shindell, F.‐M. Bréon, W. Collins, J. Fuglestvedt, J. Huang, D. Koch, J.‐F. Lamarque, D. Lee, B. Mendoza, T. Nakajima, A. Robock, G. Stephens, T. Takemura and H. Zhang, 2013: Anthropogenic and Natural Radiative Forcing. In: Climate Change 2013: The Physical Science Basis. Contribution of Working Group I to the Fifth Assessment Report of the Intergovernmental Panel on Climate Change [Stocker, T.F., D. Qin, G.‐K. Plattner, M. Tignor, S.K. Allen, J. Boschung, A. Nauels, Y. Xia, V. Bex and P.M. Midgley (eds.)]. Cambridge University Press, Cambridge, United Kingdom and New York, NY, USA.

[3] Crippa, M., Guizzardi, D., Solazzo, E., Muntean, M., Schaaf, E., Monforti-Ferrario, F., Banja, M., Olivier, J.G.J., Grassi, G., Rossi, S., Vignati, E., GHG emissions of all world countries – 2021 Report, EUR 30831 EN, Publications Office of the European Union, Luxembourg, 2021, ISBN 978-92-76-41547-3, doi:10.2760/173513, JRC126363.

Uncategorized
0

Major Breakthrough in Electric Vehicle Technology

A groundbreaking discovery by researchers has opened the door to electric vehicles that generate more electricity than they consume. 

Research led by Dr Flora Loips at the Aprilscherz Institut found that a new chemical compound, Ap1F4, could be used to create batteries that generate electricity themselves. 

While regenerative braking has been around for some time, allowing EVs to recharge their batteries when slowing down, this new technology also provides power when an EV is accelerating.

Some commentators have expressed scepticism about the finding suggesting that this would break the laws of physics but Dr Loips remains confident about her discovery.  

She told us ‘I have consulted a panel of experts on Twitter who all agree that the Second Law of Thermodynamics is very out-of-date. And these are good scientists who have been frequent commentators on Covid over the last couple of years before moving on to energy with the current oil and gas crisis.’

Air Quality Air Quality, Clean Air Zone, Electric Vehicles, Policy
1

Britain’s first Zero Emissions Zone

This blog was originally written for New AutoMotive and accessible here.

Last month, Oxfordshire County Council and Oxford City Council will introduce Britain’s first Zero Emission Zone (ZEZ) in Oxford. The pilot scheme started on 28th February 2022 and applies to a limited number of roads in the city centre. Nonetheless, Oxford ZEZ represents a radical change compared to most already existing Clean Air Zones (CAZ) across the country, as ultra low emitting vehicles (i.e. vehicles with emissions of 75 gCO2/km or less) travelling across the region will now face a fee.

Clean Air Zones are restricted areas where only the cleanest (i.e. less emitting) vehicles are encouraged to drive. Any non-compliant vehicle would be required to pay a fee to travel across the zone. The Government introduced this measure to improve air quality in response to the increasing concern about the impact of air pollution on human health.

In addition to the expected CAZ objectives, Oxford’s ZEZ aims to promote the shift towards zero-emission transport, thus slashing carbon emissions. For this reason, we investigated whether the introduction of Oxford’s ZEZ or a CAZ in general impacts the car market using Birmingham and Oxford’s case studies.

Birmingham City Council initially intended to introduce a CAZ in early 2020. The launch date was postponed to 1st June 2021 in response to the Covid-19 pandemic. We compared the UK average and Birmingham’s market share of Battery Electric Vehicles (BEVs) as a function of time, as shown in Figure 1.

Figure 1. Time series plot of UK’s average and Birmingham Battery Electric Vehicles (BEVs) market share. The black dotted lines represent the key dates in the policy introduction. The data is relative to the period between December 2018 and December 2021. Source: New AutoMotive.

Figure 1 indicates that Birmingham’s BEVs market share matched the UK average until the Government approved the CAZ. Shortly after this event, Birmingham’s BEVs market share climbed consistently above the UK’s average. A similar trend can be observed for Oxford in Figure 2.

Figure 2. Time series plot of UK’s average and Oxford Battery Electric Vehicles (BEVs) market share. The black dotted lines represent the key dates in the policy introduction. The data is relative to the period between December 2018 and December 2021. Source: New AutoMotive.

The behaviour observed in Figure 2 indicates that the introduction of the ZEZ seems to accelerate the uptake of zero-emission vehicles in the area, as desired by the policy.

BEVs market share data for the considered case studies suggest that the introduction of Clean Air (or Zero Emission) Zones promotes the uptake of BEVs. Specifically, an increase in BEVs sales was observed after the policies were approved or announced, regardless of whether the launch date was postponed for different reasons.

While Oxford represents the first and only Zero Emission Zone in the UK, other councils like Bradford and Great Manchester will introduce CAZ later this year, hopefully increasing the uptake of electric vehicles in these areas.

1 2
Back to top
  • About me
  • Blog
  • Vajont
  • Milestones
CONTACT ME:

© Andrea Di Antonio 2026
visitControguerra.it: La città del buon vivere

Privacy Policy